
Abstract
This paper investigates the sustainability practices and challenges of the global automobile industry by examining various companies. It highlights the most sustainable automobile brands, including BYD, Tesla, Volkswagen, Geely, and Mercedes-Benz, analysing their market capitalizations, growth trends, and innovations in electric vehicles (EVs). Conversely, it also analyses the car brands, such as Ferrari, Subaru, Lincoln, Maruti Suzuki, and Toyota Motors, who to this day do not have an EV vehicle on the market. Through statistical analysis, the paper contrasts the growth and volatility of EV and non-EV companies, revealing the significant shifts in market dynamics driven by sustainability trends and consumer preferences toward greener technologies. The study aims to underscore the critical role of sustainable practices in the future success of automobile manufacturers amidst the global push for environmental responsibility.
Chapter 1. Introduction
1.1 Background Knowledge
How unsustainable are petrol/diesel cars?
As the most convenient mode of transportation, there are a total of 75.3 million cars that are sold worldwide as of 2023 [Carlier]. By 2030, there is an estimated amount of 127 million vehicles that will be produced globally [The World Counts]. Every year, highway vehicles release about 1.5 billion tonnes of greenhouse gases, mostly in the form of carbon dioxide, contributing towards the growing concern of global warming. Each gallon of gasoline burned creates 20 pounds of greenhouse gas emissions; in total, a vehicle produces 5-9 tonnes of emissions [Fuel Economy].
Not only are diesel cars extremely harmful to human health by causing asthma and respiratory illnesses, diesel cars also contribute to the production of ground-level ozone, which damages trees, crops and other vegetation. On top of that, the gas produced by these cars contribute to acid rain, killing off wildlife and damaging property [EPA]. The transportation sector burns most of the world’s petroleum, which is the reason why non-renewable energy resources are running out and global greenhouse gas emissions are rising.
80-90% of the cars’ environmental impact comes from fuel consumption and emissions of air pollution and greenhouse gases. In order to move away from fossil-fuelled cars and cut greenhouse gas emissions in half by 2030, the adoption of electric vehicles provides a pathway to offsetting the effects of climate change; it is a path that we must take.
What are Electric Vehicles?
Electric vehicles (EVs) are vehicles that use one or more electric motors for propulsion instead of an internal combustion engine [Ford and Gitlin]. They are powered by rechargeable batteries and can be plugged into charging stations to replenish their energy. EVs include fully electric cars that run solely on battery power, as well as plug-in hybrid vehicles that combine an electric motor with a conventional engine. Compared to traditional gasoline-powered vehicles, EVs produce zero direct emissions, are more energy-efficient, quieter to operate, and typically have lower maintenance costs due to having fewer moving parts [e-AMRIT]. As technology advances and charging infrastructure expands, EVs are becoming an increasingly popular and environmentally-friendly alternative to conventional vehicles.
1.2 Literature Review:
The popularity of electric vehicles is rising, with the global electric fleet rising to 40 million in 2023. This positive trend is expected to repeat itself in 2024. Sales in the first quarter of the year have grown by 25% compared to the same period in 2023 [Virta], showing that the sustainability of transportation is becoming more prominent in society.
There have been a large number of studies conducted on electric vehicles, focusing on aspects from life cycle to factors affecting user adoption. A study conducted on the ‘Comparative Environmental Life Cycle Assessment of Conventional and Electric Vehicles’ (T. R. Hawkins et. al., 2013) highlights the environmental impacts of conventional internal combustion engine vehicles (ICEVs) and electric vehicles (EVs).
It was found that electric vehicles powered by the European electricity mix offer a 10-24% decrease in global warming potential (GWP) relative to traditional diesel or gasoline vehicles assuming lifetimes of 150,000 km [Hawkins et.al.]. However, the progress of electric vehicles still requires some work as the paper also notes that production impacts are more significant for electric vehicles compared to conventional vehicles. Although the effects of using electric vehicles are more beneficial, the production impact exhibits signs of human toxicity, eutrophication and metal deletion impacts, which society is working to counter in the status quo.
Another study conducted by Yoann Le Petit under the Transport & Environment organisation, titled ‘Electric vehicle life cycle analysis and raw material availability’, measures the lifecycle analysis of electric vehicles and the relationship to greenhouse gas emissions. It highlights that even in countries with the highest greenhouse gas emissions intensity – Poland and Germany – the electric vehicles perform better on a lifecycle basis than the diesel car. Using the Polish average, an electric vehicle emits 25% less CO2 over its lifetime. The greenhouse gas emission footprint associated with driving an electric vehicle in Sweden is 85% lower than for the benchmark of diesel cars [Petit].
A study conducted by the International Energy Agency (IEA) gives a comprehensive analysis of the global EV markets. Titled ‘Global Electric Vehicle Outlook 2023’, the report shows that China is dominating the global market, with more than 1.3 million electric cars being registered in the first quarter of 2023. Europe is not far behind, however high prices have impacted the competitiveness of electric vehicles, resulting in higher manufacturing costs due to high electricity and gas prices.
Overall, the race to produce more electric vehicles is happening. In 2022, the number of available options reached 500, up from below 450 in 2021 and more than doubling relative to 2018-2019. With a compound annual growth rate (CAGR) of 30% over the 2016-2022 period, it is expected that there will be a large number of entrants bringing innovative products to the market, allowing incumbents to diversify their portfolios [IEA].
Through these multiple studies, it can be seen that electric vehicles do make the world more sustainable. Their growth rate is increasing, and the usage of electric vehicles is becoming more prominent. It is without a doubt that electric vehicles are here to stay.
Chapter 2. The 5 Most Sustainable Automobile Brands
The 5 most successful EV automobile brands [Swallow] were selected for this research paper and their market cap in the past decade has been compared. The data has been adjusted for inflation (Forward Flat Rate Inflation Calculator) to the period of May 2024 to ensure that the values are presented in constant terms, allowing for accurate year-over-year comparisons and meaningful analysis of market trends without the distortion caused by inflation.
| Year | Market Cap BYD ($Bn) | Market Cap Tesla ($Bn) | Market Cap Volkswagen ($Bn) | Market Cap Geely ($Bn) | Market Cap Mercedes-Benz ($Bn) |
| 2014 | 17,51 | 37,08 | 139,99 | 3,71 | 119,04 |
| 2015 | 27,23 | 41,79 | 100,88 | 6,21 | 120,24 |
| 2016 | 23,27 | 45,04 | 94,18 | 11,01 | 102,50 |
| 2017 | 33,35 | 67,04 | 128,74 | 39,84 | 133,12 |
| 2018 | 24,11 | 71,84 | 99,12 | 19,79 | 70,27 |
| 2019 | 20,81 | 93,01 | 120,59 | 22,03 | 72,68 |
| 2020 | 94,69 | 811,71 | 122,39 | 40,57 | 92,28 |
| 2021 | 141,97 | 1230,00 | 148,36 | 31,71 | 94,90 |
| 2022 | 100,76 | 417,43 | 77,57 | 15,79 | 75,22 |
| 2023 | 83,24 | 814,17 | 66,16 | 11,40 | 76,18 |
Table 1. Market Cap of top 5 automobile brands in the past decade (adjusted for inflation).
I. BYD
BYD (Build Your Dreams) is a world renowned Chinese manufacturing company founded by Wang Chuang in 1995. The company is well known for its approach towards sustainability, where they intend to decrease greenhouse emissions by replacing every car containing an internal combustion engine with an EV.
Between 1995-2002, the mobile phone industry in China faced rapid growth. BYD originally gained success producing rechargeable batteries to fulfil this increase in demand, becoming the leader in the market. During 2003, BYD sought out plans for diversifying its company, leading to the acquisition of the Tsinchuan Automobile Company due to the promise of the emerging state of the EV market. By 2008, BYD began developing electric and hybrid vehicles, first marking the launch of the F3DM.
The significance of the F3DM cannot be understated as it was the world’s first mass-produced plug-in hybrid vehicle (PHEV). Furthermore, F3DM uses BYD’s proprietary lithium iron phosphate (LiFePO4) battery, which has a reputation for its profound durability, safety and environmental benefits [CTECHi]. The launch of the F3DM really helped fuel BYD’s successful start in the automotive industry, with individuals like Warren Buffet investing $232 million in BYD, acquiring a 10% stake [Reuters].
Following the success of F3DM, BYD unveiled the e6 in 2010. The e6 marked the company’s attempt towards producing electric taxis to address urban transportation challenges. Despite managing to sell 3 units on its launch year in China, the e6 eventually managed to gain significant traction across the world [Reuters]. Many cities worldwide began adopting BYD’s electric taxis, including Los Angeles, London, Shenzhen etc. The e6 also gained significant praise for its spacious interior, making it a suitable taxi for providing occupants with a comfortable surrounding.
Looking to adhere to its vision of a world consisting of only EV vehicles, BYD continued to introduce new models. In 2015, the BYD Tang was launched – a midsize SUV with an improved plug-in hybrid system. The model was revolutionary, providing users with a futuristic experience coupled with sustainable features. Five years later in 2020, BYD unveiled the Han, which was regarded as the top-tier sedan in the global market. At this point, BYD had firmly established its presence in the automotive industry.
BYD’s approach to sustainability is made evident through how they deal with waste. The company has imposed strict regulations regarding this matter, where toxic or harmful substances are handled by accredited external agencies, and domestic waste is handled by external environmental sanitation departments. Also most of the company’s recyclable waste is reused, with some recycled by professional units [BYD]. Furthermore, many of their factories run solely on green power, particularly power generated by solar panels, helping reduce emissions. However, some factories in China are currently unable to access green energy. This is due to their dependence on the Chinese energy grid, which, despite the Chinese government investing heavily in renewable energy, still relies on fossil fuels.
BYD’s market cap as of June 2024 is $94.63 billion, making it the world’s 177th most valuable company. As seen in the graph below, BYD overall has had a rising market cap. Between 2015-2019 no major fluctuations can be seen, however from 2019-2021 we see the market cap surge. This is largely due to the rise in EV demand in China, where BYD managed to sell around 400,000 EVs [Carlier]. Despite all of this success, from 2021-2023 a decline in market cap can be seen. This was at a time where the COVID pandemic was at its peak, particularly in China, and global supply chains were severely affected. This was particularly devastating for BYD as they faced a shortage of semiconductors, therefore translating to a decrease in production and growth.
II. Tesla
Founded by Martin Eberhard and Marc Tarpenning in 2003 as Tesla Motors, Tesla, Inc. has found itself at the core of the energy and the automotive world, becoming the first electric car brand, taking the world by its feet. The founders envisioned Tesla as a company that would create electric cars that were efficient, powerful, and nicely designed – like those powered by gasoline, yet suitable for the environment. In 2004, Elon Musk invested $6.5 million in Tesla and became the board’s chairman. This provided Tesla with sizable funding and leadership in its early stages. Musk’s power only continued to grow as he became the CEO and product architect by 2008, pushing Tesla into exponential growth and technological advancement ahead of many other car brands in the world, while being eco-friendly.
The Roadster, launched in 2008, was the first vehicle Tesla manufactured and the first defining moment for the firm and the electric car market in general. It had over 200 miles of range between charges. The Roadster represented the very first highway-legal electric vehicle running with lithium-ion battery cells, which was revolutionary. The high performance gained from this car earned Tesla a reputation and generated enough financing for it to take on more significant projects, which would spread the word about Tesla and electric cars as a whole.

Its output was followed in 2012 by a luxury sedan known as the Model S. Tesla was highly praised for its economy in energy consumption, perfect safety, and excellent performance, raising the bar for electric cars. Then, in 2015, Tesla launched the luxurious sport utility vehicle Model X into the market. By 2017 it would be manufacturing a reasonably priced sedan in the form of the Model 3, targeting mass-market consumers. It is now amongst the best-selling electric cars worldwide, further consecrating Tesla’s position in the automotive world. Parallel to this growth path have been noteworthy changes in software, manufacturing processes, and enhanced battery technology.

Construction of gigafactories was in progress in Nevada, New York, Shanghai, and Berlin. These factories have effectively expanded Tesla’s production capacity while reducing battery costs and improving operational efficiency. This allows it to sell to many people while having sustainable business practices.
Besides impacting the car industry, Tesla influences energy storage and, more generally, renewable energy. Building out from its energy storage products in particular, the Powerwall and the Powerpack, Tesla’s acquisition of SolarCity in 2016 provided the products with a complement: solar power solutions.
Tesla frequently mentions its ethical sourcing, including the metals used to manufacture the car and the batteries used to power it. Interestingly, Tesla pioneered the FSD and Autopilot technologies, which are concerned with continuously improving the safety and convenience aspects of driverless driving technologies.
In contrast, within the ESG definition around how workers are actively being treated in a company, according to CNN, Elon Musk was sued for treating women as sexual objects to be evaluated on their bra size, bombarding the workplace with lewd sexual banter representing his lack of professionalism throughout the company, and scored low in the social definition of ESG [CNN].
The growth and impacts are vivid in terms of the market value attained by Tesla. Tesla is one of the world’s most valued car companies, with a market valuation of more than $567.7 billion as of the 2024 evaluation. Of course, this surpasses multiple traditional automotive giants combined, showing the market’s faith in Tesla’s products going forward. The stock has rewarded investors with sales growth and growing profit margins for Tesla’s cutting-edge goals and technologies.
Following Tesla’s success, traditional car-makers were also placed at an increased pace for electric cars, raising competition and accelerating innovation in the EV industry. Tesla also inspired multitudes of car brands worldwide to create more electric cars and make the world more eco-friendly. Across the world, similar goals were regulated and incentivised by governments, partly because of Tesla’s success and advocacy regarding renewable energy sources and electric vehicles.
III. Volkswagen
Volkswagen (translating to ‘people’s car’) is a well-established German manufacturer of automobiles, often regarded as one of the world’s leading manufacturers of automobiles and commercial vehicles. Founded by the German government in 1937, their original aim had been to provide German citizens with readily available and affordable cars. Not only did this boost the economy, but also provided a sense of pride and progress among the German people. Nowadays, Volkswagen’s approach to manufacturing cars is clear; aiming to provide vehicles for people in a sustainable manner.
From post World War II to the early 21st century, Volkswagen manufactured numerous vehicles that gradually fuelled their success and contributed towards the growth of the company. The very first Volkswagen to come off the production line was the KdF-Wagen car, more commonly known as the Beetle. Developed by Dr. Ferdinand Porsche in 1938, production of the Beetle was limited due to factories prioritising the production of military vehicles. However, during the 1950s, the vehicle became a worldwide sensation, managing to gain traction for its compact and efficient design coupled with its affordable price. By 1955, the one-millionth Beetle was produced [Carlist].
The success of the Beetle worldwide helped establish Volkswagen’s presence in the automobile industry and therefore encouraged the company to diversify its product lineup. One of the first vehicles Volkswagen introduced post beetle success was the Volkswagen Type 2 (Transporter). This vehicle was available in several configurations, including a pick up truck, a cargo van, a camper van etc, making it a very suitable vehicle for a wide range of uses. This vehicle appealed to many due to its boxy shape and large windows, becoming an iconic vehicle amongst individuals during the 1960s.
During the 2010s, Volkswagen started to engage more heavily in the development of EVs. The company’s early attempts at this during the 1970s had been quite revolutionary as their first all-electric vehicle had a range of 43.5 miles, a top speed of 43.5 miles per hour, and could charge to full in 10 hours from the ordinary plug socket [Volkswagen]. They were only able to capitalise on these innovations when demand for EVs started to increase during the 2010s. It was during 2013 that the VW e-UP! was introduced. This vehicle featured a 18.7 kWh battery pack with a range of around 160 kilometres and was an electric version of its small city car, marking the start of Volkswagen’s major advancements in regards to EVs.
Ever since this boom in demand for EVs, Volkswagen has introduced several new and innovative vehicles. For example, most recently Volkswagen introduced the ID.7 GTX in June of 2024. This vehicle adheres to the company’s aim of being sustainable, producing zero emissions, accommodating a significant amount of recycled material in its construction, and being equipped with advanced lithium ion batteries that are considerably more efficient and comparably less resource intensive [Volkswagen Newsroom].
One of Volkswagen’s main goals is to reach complete carbon neutrality by 2050, and in order to achieve this they’ve been focusing on the sustainability of their manufacturing processes. For instance, the Chattanooga plant makes use of 100% renewable energy, lowering CO2 emissions per vehicle by two-thirds since 2012 [Volkswagen]. Furthermore, VW Chattanooga accommodates one of the largest solar fields in Tennessee, managing to generate enough electricity to power 1200 homes a year. They are also investing heavily in schemes to recycle EV batteries, collaborating with the likes of Redwood Materials to ensure this happens [Koch].
IV. Geely
Geely Automobile Holdings Limited has demonstrated a strong commitment to environmental sustainability and biodiversity protection in recent years. The company has incorporated environmental concerns into its core business strategy and operations.
Geely has included biodiversity protection in its project construction processes, implementing measures at various stages to minimise negative impacts on ecosystems. During the planning and design stage, the company conducts environmental impact assessments. In the construction phase, they focus on minimising harm to biodiversity. For ongoing operations, Geely ensures environmental protection acceptance and ISO 14001 certification [Citi]. The company has also taken practical steps to create ‘garden style factories’ that promote harmonious coexistence between industrial activities and nature. Geely is actively making significant strides in EV technology. This new battery system, named ‘Aegis’, represents a major advancement in EV battery performance and efficiency [Geely].
Key feature of this battery include:
- High energy density: The battery boasts an impressive energy density of 192Wh/kg, which contributes to improved range and performance.
- Long lifespan: The battery is designed to last up to 3,500 cycles, ensuring longevity and reliability for EV owners.
- Fast charging capabilities: While specific charging times are not known, the new technology is said to offer fast charging capabilities, addressing one of the key concerns for EV adoption.
They have also developed other EV-related innovations which ultimately demonstrate Geely’s commitment to pushing the boundaries of EV technology, focusing on improving energy efficiency, range, safety, and most importantly their impact on the environment.
V. Mercedes-Benz
Mercedes-Benz was founded in 1926 by Karl Benz and Gottlieb Daimler. It has been the centre of the automotive industry for over a century and is known for its luxurious and lavish vehicles that are simultaneously high-performing. The founders envisioned Mercedes as a company that would set the standard for the automotive industry with their sophisticated design. Further into the 1900s, Mercedes continued to develop the Mercedes brand by creating a well-known reputation for quality, sustainable cars.
Mercedes’ success started to pick up with the release of the SSK in 1928. This car stunned the public with its speed and power while maintaining its luxury aspect. This set the stage for what Mercedes had in store for the public and the future. Other luxury car brands took such inspiration from Mercedes because they knew the public liked what Mercedes created. In 1954 with the 300 SL, Mercedes once again stunned the public, incorporating the latest technologies into the automotive industry.
In the late 20th century, Mercedes started moving towards luxury sedans to provide cars for a new demographic. Unsurprisingly, the S-Class was a huge success, with new features including airbags and antilock brakes. The S-Class paved the way for Mercedes to create more sustainable cars while also maintaining that luxury aspect that their customers desired.
Customers first saw Mercedes’ shift to sustainability in 2008, when the company introduced the BlueEFFICIENCY technology, which marked its effort to reduce fuel consumption and emissions. As electric cars were introduced to the world, Mercedes created EQC in 2019. This was Mercedes’ first all-electric SUV, which allowed customers to stay with the luxury car brand while taking part in creating an eco-friendlier world.
Mercedes aims for high quality, thus forcing it to establish production plants in countries all around the world that meet sustainability standards for its workers and materials. These production plants are seen in countries such as Germany, the United States, India and China. Without these global production plants, Mercedes would be unable to cater to such a diverse clientele as they work with today.
In addition to its automotive achievements, Mercedes has significantly contributed to sustainable energy solutions. Mercedes has invested in and committed to renewable energy, planning to have a fully carbon-neutral fleet of cars by 2039, underscoring its dedication to making the automotive industry more sustainable.
In contrast, Mercedes has faced multiple complaints regarding their labour practices and ethical concerns, despite their strong urge for sustainability. Since then, Mercedes has worked towards aligning with the definition of ESG and making Mercedes a more ethical company for which to work.
Today, Mercedes is one of the most valuable and respected automotive companies ever. As of 2024, its market valuation was over $100 million. This position in the market recognises the brand’s appeal and ability to change its business practices with changing market dynamics while continuing to provide high quality.
In conclusion, Mercedes is a world-renowned company that has dominated the automotive market for years with its extensive range of products and cars and its ability to conquer any issues that come their way, whether it be ethically, within the company or a changing market. Most recently, Mercedes has tried to make their brand more sustainable by pledging to be fully electric by 2039 and creating their first electric car in 2019. In addition to trying to become fully sustainable, their cars are produced and made from fully ethical materials, representing their passion for going green.
2.1 Statistical Analysis
I. BYD
| Year | Market Cap ($Bn) | Percentage Change (%) |
| 2014 | 17.51 | – |
| 2015 | 27.23 | 56 |
| 2016 | 23.27 | -15 |
| 2017 | 33.35 | 43 |
| 2018 | 24.11 | -28 |
| 2019 | 20.81 | -14 |
| 2020 | 94.69 | 350 |
| 2021 | 141.97 | 50 |
| 2022 | 100.76 | -29 |
| 2023 | 83.24 | -17 |
Table 2. BYD market cap table (adjusted for inflation).

Figure 1. BYD market cap graph (adjusted for inflation).
II. Tesla
| Year | Market Cap ($Bn) | Percentage Change (%) |
| 2014 | 37.08 | – |
| 2015 | 41.79 | 13 |
| 2016 | 45.04 | 8 |
| 2017 | 67.04 | 49 |
| 2018 | 71.84 | 7 |
| 2019 | 93.01 | 29 |
| 2020 | 811.71 | 773 |
| 2021 | 1230.00 | 52 |
| 2022 | 417.43 | 66 |
| 2023 | 814.17 | 95 |
Table 3. Tesla market cap table (adjusted for inflation).

Figure 2. Tesla market cap graph (adjusted for inflation).
III. Volkswagen
| Year | Market Cap ($Bn) | Percentage Change (%) |
| 2014 | 139.99 | – |
| 2015 | 100.88 | -28 |
| 2016 | 94.18 | -7 |
| 2017 | 128.74 | 37 |
| 2018 | 99.12 | -23 |
| 2019 | 120.59 | 22 |
| 2020 | 122.39 | 1 |
| 2021 | 148.36 | 21 |
| 2022 | 77.57 | -48 |
| 2023 | 66.16 | -15 |
Table 4. Volkswagen market cap table (adjusted for inflation).

Figure 3. Volkswagen market cap graph (adjusted for inflation).
IV. GEELY
| Year | Market Cap ($Bn) | Percentage Change (%) |
| 2014 | 3.71 | – |
| 2015 | 6.21 | 67 |
| 2016 | 11.01 | 77 |
| 2017 | 39.84 | 262 |
| 2018 | 19.79 | -50 |
| 2019 | 22.03 | 11 |
| 2020 | 40.57 | 84 |
| 2021 | 31.71 | -22 |
| 2022 | 15.79 | -50 |
| 2023 | 11.40 | -28 |
Table 5. Geely market cap table (adjusted for inflation).

Figure 4. Geely market cap graph (adjusted for inflation).
V. Mercedes-Benz
| Year | Market Cap ($Bn) | Percentage Change (%) |
| 2014 | 119.04 | – |
| 2015 | 120.24 | 1 |
| 2016 | 102.50 | -15 |
| 2017 | 133.12 | 30 |
| 2018 | 70.27 | -47 |
| 2019 | 72.68 | 3 |
| 2020 | 92.28 | 27 |
| 2021 | 94.90 | 3 |
| 2022 | 75.22 | -21 |
| 2023 | 76.18 | 1 |
Table 6. Mercedes-Benz market cap table (adjusted for inflation).

Figure 5. Mercedes-Benz market cap graph (adjusted for inflation).
2.1.1 Linear Regression Analysis
| Company | Slope | Intercept | R^2 |
| BYD | 11.40 | -5.99 | 0.60 |
| Tesla | 107.90 | -230.53 | 0.56 |
| Volkswagen | -3.36 | 128.28 | 0.15 |
| Geely | 1.48 | 12.07 | 0.11 |
| Mercedes-Benz | -5.21 | 124.28 | 0.44 |
I. BYD and Tesla: Strong Growth Trends
BYD: With a positive slope of 11.40 and a relatively high R-squared value of 0.60, BYD’s market cap has been growing steadily. This suggests that BYD, a leading EV company, has seen substantial success over the decade.
Tesla: Tesla’s extremely high slope of 107.90 and a moderate R-squared value of 0.56 indicate explosive growth. Tesla’s success in the EV market is evident, with significant market cap increases, despite some variability.
II. Volkswagen and Mercedes-Benz: Declining Trends
Volkswagen: The negative slope of -3.36 and low R-squared value of 0.15 indicate a declining market cap with high variability. This reflects the challenges faced by Volkswagen, a traditional automaker, in transitioning to the EV market.
Mercedes-Benz: Similarly, the negative slope of -5.21 and moderate R-squared value of 0.44 suggest a decline in market cap. This further supports the idea that traditional automakers may struggle compared to pure EV companies.
III. GEELY: Moderate Growth with High Variability
Geely: The positive slope of 1.48, but low R-squared value of 0.11, indicate modest growth with significant fluctuations. This shows that Geely, while involved in the EV market, has not experienced the same level of consistent success as BYD and Tesla.
2.1.2 Growth
Compound Annual Growth Rate (CAGR) refers to the mean annual growth rate of an investment over a specified period of time longer than one year [Eichler]. It represents one of the most accurate ways to calculate and determine returns for anything that can rise or fall in value over time. The CAGR is particularly useful for comparing the growth rates of different investments or companies over the same period.
Using the formula:
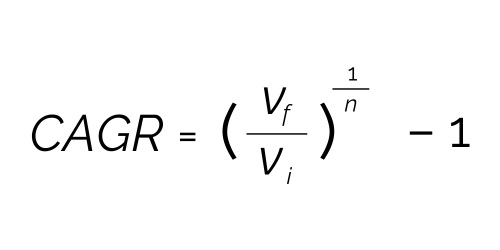
- Where Vf is the final value of the investment
- Vi is the initial value of the investment
- n is the number of years
| Company | Compound Annual Growth Rate (CAGR) (%) |
| BYD | 17.23 |
| Tesla | 36.19 |
| Volkswagen | -7.20 |
| Geely | 11.88 |
| Mercedes-Benz | -4.36 |
I. BYD
CAGR: 17.23%
Interpretation: BYD has shown a strong growth rate of 17.23% annually. This indicates strong market performance and a consistent increase in market capitalisation over the period. BYD’s investments in EV technology and expansion of its EV lineup have likely contributed to this significant growth.
II. Tesla
CAGR: 36.19%
Interpretation: Tesla’s exceptional CAGR of 36.19% highlights it as a leader in the EV market. Tesla’s continuous innovation, strong brand recognition, and widespread adoption of its vehicles have pushed its market cap growth. This remarkable rate reflects Tesla’s dominant position and successful business strategy in the EV sector.
III. Volkswagen
CAGR: -7.20%
Interpretation: The negative CAGR of -7.20% for Volkswagen indicates a decline in its market capitalisation over the period. Despite its efforts in the EV market, this decline suggests challenges such as market competition, transition issues from internal combustion engine vehicles to EVs, or other operational difficulties that have negatively impacted its overall market performance.
IV. GEELY
CAGR: 11.88%
Interpretation: Geely’s CAGR of 11.88% signifies healthy growth in the EV market. Geely has been investing in EV technology and expanding its portfolio, which has translated into a steady increase in market cap. This growth rate reflects Geely’s successful adaptation to the EV market trends and consumer demand.
V. Mercedes-Benz
CAGR: -4.36%
Interpretation: The negative CAGR of -4.36% for Mercedes-Benz indicates a decline in market capitalisation over the period. Similar to Volkswagen, Mercedes-Benz may be facing challenges in transitioning to EVs or dealing with competitive pressures. This decline suggests the need for strategic adjustments to better capture the EV market.
2.1.3 Volatility
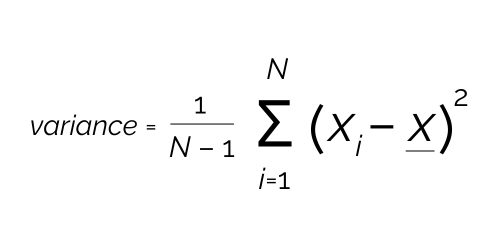
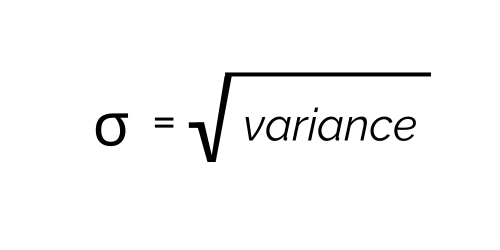
Volatility refers to the degree of variation in the price or value of a financial instrument over time. It is a statistical measure of the dispersion of returns for a given security or market index. In the context of market capitalisation growth rates, volatility represents the extent to which the growth rates fluctuate over a specified period. Standard deviation is the most common measure of volatility, calculated as the square root of the variance [Velasquez]. It indicates how much the individual data points deviate from the mean. Variance is the average of the squared differences from the mean, providing a measure of the dispersion – high volatility indicates large fluctuations in value, while low volatility indicates more stable values.
Using the formulae:
a. Calculating the mean of percentage change values
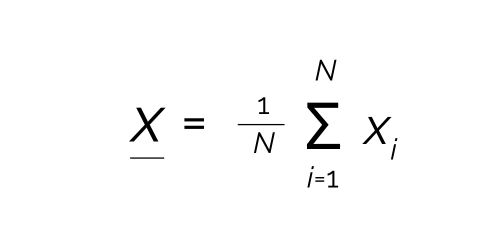
- Where xi = individual percentage change values
- N = number of observations
b. Variance
c. Volatility (standard deviation)
| Company | Volatility |
| BYD | 112.51 |
| Tesla | 2.39 |
| Volkswagen | 0.28 |
| Geely | 1.01 |
| Mercedes-Benz | 0.24 |
I. BYD
Volatility: 112.51
Interpretation: BYD shows the highest volatility, indicating substantial fluctuations in its market cap. This reflects significant changes, such as rapid growth phases and potential market or operational challenges.
II. Tesla
Volatility: 2.39
Interpretation: Tesla has a relatively high volatility compared to traditional automakers, but much lower than BYD. This suggests substantial growth with some fluctuations, likely due to innovation cycles and market dynamics.
III. Volkswagen
Volatility: 0.28
Interpretation: Volkswagen exhibits low volatility, indicating stable market cap changes. This reflects a more stable performance, possibly due to its established market position and gradual transition to EVs.
IV. Geely
Volatility: 1.01
Interpretation: Geely’s volatility is moderate, showing some fluctuations in market cap. This suggests a balanced growth approach with occasional variations due to market or strategic changes.
V. Mercedes-Benz
Volatility: 0.24
Interpretation: Mercedes-Benz shows the lowest volatility, indicating very stable market cap changes. This reflects its steady performance and cautious approach towards EV market integration.
2.2 Summary
The analysis reveals that traditional gas-reliant automakers like Volkswagen and Mercedes-Benz are facing challenges, as evidenced by their negative CAGRs of -7.20% and -4.36%, respectively. Despite efforts to transition to electric vehicles, these companies exhibit negative growth and low volatility, with Volkswagen showing a standard deviation of just 0.28, indicating very stable yet declining market cap changes. In contrast, EV-focused companies like Tesla and BYD are experiencing explosive growth. Tesla’s CAGR of 36.19% and standard deviation of 2.39 highlight its dominant market position and substantial growth, albeit with some fluctuations. Similarly, BYD shows a strong CAGR of 17.23% ,but high volatility with a standard deviation of 112.51, reflecting significant growth phases mixed with fluctuations. This disparity underscores how the shift in consumer preferences towards sustainability and electric vehicles is driving success for companies dedicated to EV production, while traditional automakers, still heavily reliant on gasoline vehicles, struggle to adapt. This transition will take time, as many consumers and markets continue to depend on gasoline-powered cars, delaying the full impact of these evolving preferences.
Chapter 3. The 5 Most Unsustainable Automobile Brands
I. Ferrari
Ferrari became a public company on 21 October 2015 at $52 per share on the New York Stock Exchange. Ever since, despite its reluctant attitude towards EVs, its stock prices have been rising. Ferrari’s partnership with Shell, infamous for the environmental damages that it has caused, and the renewal of this partnership on 19 February 2024 gives a cause for suspicion from environmentalists [Automobili Ferrari]. However, together they plan to innovate and create biofuels to reduce the carbon footprint of Ferrari cars, which according to Earth 911 is 3,608 kg per car – equal to 294 km of aeroplane travel [Wise]. Ferrari is one of the top world producers of luxury sports cars such as the Ferrari Roma, Ferrari 812 GTS, Ferrari F8 and more.

Though Ferrari does not yet offer EVs, and does not plan on having them since the CEO Amedeo Felisa claims that electric motors do not provide the ‘oomph’ that makes a ferrari special [Scuderia Ferrari Club], they have confirmed that there will be hybrid Ferraris available in a few years time. Felisa elaborates to explain that they may borrow the technology that is used in the production of their F1 cars and place it in their normal car line to help reduce emissions. The former President stated that ‘I don’t believe in electric cars, but I strongly believe in hybrids,” and that Ferrari plans on spending €250 million into research and development to lower emissions [ibed].
According to an article posted by the GreenBiz in 2009, Ferrari’s production plant has installed a photovoltaic system and added 1075 solar panels, which generate 210,000 kWh, and a trigeneration plant that will cover most of the energy requirements and cut emissions by 25-30%. As reported by Tech Times on 21 June 2024, Ferrari opened another plant worth $214 million to produce its hybrid vehicles and EVs. This new building has 3000 solar panels and produces 1.3 MW of power [Tech Times]. The trigeneration plant is being shut down and by the end of this year this plant will be functioning on renewable energy. It is also stated that ‘60% of the energy used for battery and motor testing will be recovered and redirected to new processes’. It should be noted that since 2021, Shell supplied Ferrari with 10% biofuel for its trackside activities which reduced emissions by 50% [Shell Global].
As Ferrari heavily relies on the ‘noise factor’, it is speculated that stocks may fall with the appeal of noiseless EV cars [Sherwood]. On the other hand, many others believe that Ferrari has set itself apart as a luxury brand and is now considered a symbol of status, and hence stocks may not fall. Since Ferrari announced the launch of the new plant and the upcoming EV models, it seems as if their stock prices will not be falling any time soon. However as far as sustainability goes, although the production process and other activities are being done with environmental concern in mind, Ferrari’s revenue as of yet is not generated through the sale of any EVs, which is the basis on which this paper is categorising companies as sustainable or unsustainable. Hence Ferrari is not sustainable.
II. Subaru
Subaru is a Japanese automobile company which initially started as an aircraft research company named Fuji Heavy Industries in 1915. After becoming the chief aircraft manufacturer for Japan in World War II, the company pivoted towards car manufacturing, thus creating the Subaru brand. From 1954-2008, the company designed and manufactured dozens of vehicles including the P1, the Impreza, the Sambar EV electric van, the Forester, the Tribeca, etc.

From the 1990s, Subaru began to expand worldwide, while also expanding its range of vehicles; in particular, the Subaru Outback made waves in the 1990s as a capable and more efficient alternative to large, truck-based SUVs. They also invested in technology; in the 2000s, Subaru vehicles made great advancements in safety, and the company introduced a horizontally opposed diesel engine that became widely used [Subaru Middle East]. They made their first public offering of Subaru stock (SBRU) on the New York Stock Exchange with an opening of $3.00/share.
Subaru claims to be a sustainable company stating that, along with their retailers across the globe, they work towards reducing waste, conserving resources and preserving natural spaces – taking real, meaningful steps to achieve these goals. All Subaru products are manufactured in zero-landfill production plants, and Subaru of Indiana Automotive, Inc. is the only US automobile production plant to be designated a backyard wildlife habitat by the National Wildlife Federation.
Although they do not have electric vehicles yet, Subaru is in constant pursuit of opportunities that will protect our planet in the future. By 2029, they plan to fulfil their initiatives of zero emissions and eight electric vehicles. They are also exploring new ways to make a difference and protect the environment for future generations.
Carter Subaru is a well-established car dealership that specialises in selling and servicing Subaru vehicles located in Seattle, Washington. Since 2008, it has been ‘on the road to carbon neutral’ by ‘planting a forest, one test drive at a time’. For every test drive taken at Carter Subaru, one tree is planted. For every vehicle purchased, another three trees are planted. They plant four trees because their lifespan is about 75 years, which will absorb the approximate amount of carbon dioxide of the average car driven in one year. By doing this, they have created a legacy that will enrich our environment and our community for generations [Carter Subaru].
Sustainability in this context is based on whether Subaru makes EVs or not. However, their production is proven to be sustainable. So, are the cars sustainable? If we stick to our sustainability context, no – but they are as sustainable as it can get. Each year, Subaru actively recycles 99.3% of excess/leftover steel, plastic, wood, paper, glass and other materials. The remaining 0.7% is shipped to the city of Indianapolis and incinerated to help generate steam.
Although Subaru is committed towards environmental sustainability, currently their cars each release about 1924 kg of carbon emissions annually, which is equivalent to 157 km of airplane travel, ranking 16th out of 20 for the most polluting cars, according to Uswitch. This can be seen as the primary reason for why their market capitalisation has fallen quite drastically since 2015, and why it has only had a few minor raises in the following years [Wise].
Figure 7 shows the difference in market capitalisation from 2015. From this, we can observe that there are fluctuations and significantly higher negative differences than positive differences. Hence, Subaru should make haste in producing EVs to make sure they do not face losses.
III. Lincoln
Founded in 1917, the Lincoln Motor Company is a highly iconic American car brand, known for its outstanding innovation and luxury. Despite its 106 years of experience, Lincoln has yet to introduce a full-electric vehicle [Ugorji], such as Nautilus and Corsair. Lincoln hesitates to introduce such an unconventional vehicle in fear that this would push back customers at a Lincoln dealership.
Lincoln’s market cap as of June 2024 is $10.52 billion, making it the world’s 1571st most valuable company. With a revenue of about $4.19 billion, Lincoln has grown to a certain extent. In 2022, it made a revenue of $3.76 billion, which is a high increase from the 2021 revenue of $3.23 billion due to a shortage of semiconductor chips, leading to historically low vehicle inventories but high profits [CNBC] due to high demand. As seen in Figure 8, Lincoln has a somewhat stable rising market cap. With slight fluctuations, Lincoln’s supply of trucks and SUVs helped it to build a steady stream of revenue.
Despite this, the year of 2024 showed a decline in the market cap. At this point, the rise of electric vehicles began making a mark in the world. With electric car sales quadrupling in Brazil and increasing more than sevenfold in Vietnam, it is without a doubt that the market of electric vehicles is starting to gain momentum. Lincoln’s lack of electric vehicles might be one of the reasons sales have dropped [IEA]. On top of that, Lincoln had lost 20.9% of their stocks in the past three months of this new year compared with the industry’s 10% decline.
Although Lincoln Electric derives from Ford, which is the second most valued American automotive brand worldwide [Carlier], its success is not as well regarded. One of the reasons might be the lack of incentive for Lincoln to switch to more sustainable forms of production as the world transitions to electric vehicles. Lincoln has trouble attracting young buyers and competitors, whereas Rivian or Cadillac have already started the journey of electric vehicles, taking away a large consumer base [O’Neil].
Despite Lincoln’s claim to go electric and produce three full-electric vehicles by 2025, it has only produced one concept SUV that came out in 2022. Lincoln’s inflexibility in changing its products would reduce its sales. Not only does Lincoln sell only one type of vehicle, but it also only sells one type of fuel. With various laws banning new gasoline cars appearing, Lincoln will be highly vulnerable due to its rigid structure. Lincoln currently emits 0.4 million tonnes of carbon yearly; if this goes on, they would use up their carbon budget in approximately eleven years [Lincoln Climate Commission].
In 2020, the Lincoln Electric System Board passed a resolution to mitigate carbon emissions by establishing a goal of achieving net-zero in terms of carbon dioxide emissions by 2040. While that is said on paper, its reluctance to release fully electric vehicles due to a fear of backlash – like what happened to the Blackwood model – does not align well with consumers’ increased awareness of renewable resources.
Lincoln has made strategies to improve its sustainability for the 2020-2025 period. By incorporating ESG-related initiatives and building value for stakeholders, Lincoln Electric plans to focus on these four goals: customer focused, solutions and value, employee development and operational excellence. So far, since 2005, their carbon emissions have fallen by 42%. They plan to reduce greenhouse gas emissions from their production by 10% in 2025 and reduce energy intensity to 16% in that same year as well [Sustainability].
These methods are vital for Lincoln to operate smartly and with responsibility to grow their market and gain a competitive advantage. Lincoln is currently working with partners to have DC fast-charge electric vehicles and will likely also partner with Tesla in order to better access their infrastructure for Lincoln’s consumer base [Riser Lincoln].
IV. Maruti Suzuki
Founded on 24 February 1981, Maruti Suzuki was a joint venture between Maruti Udyog and Suzuki [Mint]. It has a strong performance as of May 2024, and this can be seen in Figure 9 where the market cap has continued to increase since 2022. In May 2024, Maruti Suzuki sold 1,440,002 units and captured 41.3% of the market share [Sharma], solidifying its position as the number one car company in India in regards to market share.
Based on Figure 9, as of June 2024, Maruti Suzuki India has a market cap of $45.72 billion, making it the 414th most valuable company in the world. They made a revenue of $16.26 billion in 2023, which has risen from a revenue of $11.13 billion in 2021, to a revenue of $13.61 billion in 2022. Its market cap is relatively stable, rising steadily with a slight spike of the market cap in 2017. Maruti Suzuki is expected to grow by 2% in 2024 [Mukherjee], performing better than most of the market and gaining a higher market share.
Despite this, there is a growing shift towards electric vehicles, and the dominant narrative of being environmentally friendly has caused large car companies to change their products or production methods. Electric vehicles in India, however, haven’t taken off due to their higher cost of acquisition, which is one of the reasons why Maruti Suzuki has yet to introduce an electric vehicle. Shashank Srivastava, a senior executive director at Maruti Suzuki, also claims that range anxiety is preventing people from buying electric vehicles. However, as of 2024, electric car sales have increased by more than 50% in the first quarter.
The government of India has implemented various measures to incentivise Original Equipment Manufacturers (OEMs) to localise battery production and its components so that acquisition costs can be reduced. Maruti Suzuki has invested over Rs 10,000 crore towards this initiative, determined to keep up with the trends [The Economic Times]. Even though they have not produced an electric vehicle, Maruti Suzuki has engaged in the production of hybrid vehicles.
Maruti Suzuki’s reluctance to take part in the electric vehicle race due to high cost is proving to be unbeneficial. Their biggest competitor, Tata Motors, has already refreshed and launched new electric vehicles multiple times. Even though electric vehicles have a high incremental cost, the cost savings on using electric vehicles are huge after the initial cost recovery [NDTV Profit].
Maruti Suzuki has claimed that one single technology like electric vehicles will not lead to achieving wider climate goals, and thus they are not worried about their lack of production of electric vehicles [Nikkei Asia]. However, it is also better to be wary of the growing gap Maruti Suzuki might have compared to its large competitors who have fully adopted electric vehicles. Even though the impact and significance of electric vehicles is not very prevalent in India, the market is unpredictable and times can change.
In order to become more sustainable, Maruti Suzuki has adopted the ISO 14001 standard and ensured compliance with Biomedical Waste Management Rules as of 2016. Their main priority is to reduce pressure on the environment, work with local communities, and control their usage of natural resources [Sustainability]. The company follows a vision of ‘circular mobility’, finding ways of reducing, reusing and recycling throughout manufacturing and production processes [Maruti Suzuki]. By incorporating the Corporate Average Fuel Economy (CAFE) regulations that were enforced on 1 April 2017, Maruti Suzuki aimed to reduce carbon emissions to less than 130 gm/km by 2022, applicable to all petrol, diesel, LPG and CNG fuelled vehicles [The Economic Times].
V. Toyota Motors
Toyota Motor Corporation is a Japanese company and is the largest automobile brand and manufacturer in the world. In 1999, Toyota was listed on the London stock exchange, as well as the New York stock exchange.
From 2005 to 2015, Toyota consistently violated the Clean Air Act and was set to pay a fine of $180 million to EPA [Reuters]. Looking at Toyota’s cars in general, they have no EVs as of yet and, according to Forbes, their CEO in 2023, Akio Toyoda, said that ‘the enemy is CO2’ and that instead of ‘regulations or policies’, customers should decide what should and should not be supplied in the market [Lyon]. Toyoda has also stated that ‘no matter how much progress BEVs (Battery Electric Vehicles) make’, their sales will not rise from 30%, which is not true considering the sales of Tesla and other companies [ibed]. Moreover, the market share of EVs in Norway is 80%, 41% in Iceland, 32% in Sweden and 24% in China, which is also expected to surpass 30% [ibed].
During 2023, the CEO was replaced by Koji Sato who, although advancing the electrification strategy, has continued to focus on hybrids and hydrogen vehicles. It must be noted that Toyota does plan on delivering 1.5 million EVs by 2026, which will make up 14% of estimated sales but not enough to be classified as a sustainable company. Toyota is also focusing on the production of e-fuels and have very recently released the Toyota bZ4X which is a fully electric vehicle. However since it has just been released, and does not make up a large proportion of their sales, it is safe to say that Toyota is still an unsustainable company [Edmunds].

Moving on to the production process, Toyota has taken up a new approach from 19 April 2024 for their new land cruiser 250. This is a bottle recycling project that is done internally by the workers themselves for the cars’ interiors. The employees wash and prepare their bottles, which results in self sufficiency [Toyota Motor Corporation]. However this initiative has just been taken on. According to Impactful Ninja, Toyota also recycles 98.4% of their waste [Boles]. They have also analysed the life cycle of Toyota cars from its sourcing of materials to end-of-life. These cars are made up of recycled material including recycled steel, however in order to maintain the high volume they have to be produced from unsustainably sourced materials. Their hybrid models also use unsustainably sourced lithium batteries. Moreover, Toyota has changed its steel supply from Japan to China, sacrificing sustainability, as well as continuing to use lithium from a mine in Nevada which is ‘controversial for its proximity to an endangered species of plant’.
Additionally, the manufacturing of Toyota cars results in the emissions of ‘millions of tons of CO2’ [ibed]. The transportation, as well as usage of the cars, does lead to more emissions, however the end-of-life of these cars is sustainable since they are ‘easily dismantled and reused, and Toyota is investing in facilities to handle them’ [ibed].
In conclusion, since Toyota has just released their first full EV, which does not make up a larger proportion of their revenue, and considering the production methods as well as the sources of the materials, this company is classified as unsustainable.
3.1 Statistical Analysis
I. Ferrari
| Year | Market Cap ($Bn) | Percentage Change (%) |
| 2015 | 15.61 | -13 |
| 2016 | 18.67 | 21 |
| 2017 | 32.97 | 80 |
| 2018 | 30.53 | -5 |
| 2019 | 50.60 | 66 |
| 2020 | 69.25 | 41 |
| 2021 | 74.42 | 13 |
| 2022 | 56.82 | -18 |
| 2023 | 85.57 | 57 |
| 2024 | 101.42 | 22 |
Table 7. Ferrari market cap table (adjusted for inflation).

Figure 6. Ferrari market cap graph (adjusted for inflation).
II. Subaru
| Year | Market Cap ($Bn) | Percentage Change (%) |
| 2015 | 43.14 | 16 |
| 2016 | 41.17 | -5 |
| 2017 | 31.17 | -24 |
| 2018 | 20.51 | -34 |
| 2019 | 23.48 | 14 |
| 2020 | 18.60 | -21 |
| 2021 | 15.88 | -15 |
| 2022 | 12.47 | -21 |
| 2023 | 14.21 | 14 |
| 2024 | 15.89 | 12 |
Table 8. Subaru market cap table (adjusted for inflation).

Figure 7: Subaru market cap graph (adjusted for inflation).
III. Lincoln
| Year | Market Cap ($Bn) | Percentage Change (%) |
| 2015 | 4.83 | – |
| 2016 | 6.62 | 37 |
| 2017 | 7.73 | 17 |
| 2018 | 6.25 | -19 |
| 2019 | 7.19 | 15 |
| 2020 | 8.46 | 18 |
| 2021 | 9.60 | 13 |
| 2022 | 8.98 | -6 |
| 2023 | 12.84 | 43 |
| 2024 |
10.78 |
-16 |
Table 9: Lincoln market cap table (adjusted for inflation).

Figure 8: Lincoln market cap graph (adjusted for inflation).
IV. Maruti Suzuki
| Year | Market Cap ($Bn) | Percentage Change (%) |
| 2015 | 27.83 | – |
| 2016 | 30.95 | 11 |
| 2017 | 58.77 | 90 |
| 2018 | 40.34 | -31 |
| 2019 | 38.34 | -5 |
| 2020 | 38.33 | -0.03 |
| 2021 | 36.58 | -5 |
| 2022 | 32.88 | -10 |
| 2023 | 40.14 | 22 |
| 2024 | 45.72 | 14 |
Table 10: Maruti Suzuki market cap table (adjusted for inflation).

Figure 9. Maruti Suzuki market cap graph (adjusted for inflation).
V. Toyota Motors
| Year | Market Cap ($Bn) | Percentage Change (%) |
| 2015 | 30.27 | 0.1 |
| 2016 | 26.73 | -9 |
| 2017 | 41.92 | 64 |
| 2018 | 34.87 | -13 |
| 2019 | 29.20 | -13 |
| 2020 | 33.13 | 16 |
| 2021 | 25.11 | -17 |
| 2022 | 17.85 | -17 |
| 2023 | 21.91 | 33 |
| 2024 | 22.63 | 10 |
Table 11. Toyota Motors market cap table (adjusted for inflation).

Figure 10. Toyota Motors market cap graph (adjusted for inflation).
3.1.1 Linear Regression Analysis
| Company | Slope | Intercept | R^2 |
| Ferrari | 0.23 | 14.24 | 0.04 |
| Subaru | -1.14 | 34.16 | 0.45 |
| Lincoln | 3.43 | -15.03 | 0.14 |
| Maruti Suzuki | 1.80 | -44.77 | 0.20 |
| Toyota Motors | 3.20 | -43.01 | 0.34 |
The slope indicates the rate of change of the dependent variable with respect to the independent variable. For example:
- Ferrari’s slope of 0.23 is low, suggesting a weak relationship between the independent and dependent variables. For every unit increase in X, Y increases by 0.23 units.
- Subaru’s slope, -1.14 units, indicates that for every unit increase in X, Y decreases by 1.14 units on average.
- Lincoln’s slope, 3.43 units, indicates that for every unit increase in the independent variable (X), the dependent variable (Y) increases by approximately 3.43 units on average.
- Maruti Suzuki’s slope, 1.80 units, suggests that for every increase in X, Y increases by 1.80 units on average.
- Toyota Motors’ slope, 3.20 units, suggests that for every increase in X, Y increases by 3.20 units on average.
The intercept is the value of the dependent variable when the independent variable is zero. It represents the starting point of the regression line on the y-axis:
- Ferrari: 14.24
- Subaru: 34.16
- Lincoln: -15.03
- Maruti Suzuki: -44.77
- Toyota Motors: -43.01
The R^2 value indicates the proportion of the variance in the dependent variable that is predictable from the independent variable. It ranges from 0 to 1, with higher values indicating a better fit:
- Ferrari (0.04): Only 4% of the variance is explained, indicating a very poor fit.
- Subaru (0.45): Similarly, only 45% of the variance is explained, indicating its moderate fit.
- Lincoln (0.14): 14% of the variance in the dependent variable is explained by the independent variable. This is a weak fit.
- Maruti Suzuki (0.20): 20% of the variance is explained, indicating a moderate fit.
- Toyota Motors (0.34): 34% of the variance is explained, indicating a relatively better fit compared to the others, but still not a very strong fit.
3.1.2 Growth
| Company | Compound Annual Growth Rate (CAGR) (%) |
| Ferrari | 24.02 |
| Subaru | -6.92 |
| Lincoln | 11.41 |
| Maruti Suzuki | 8.09 |
| Toyota Motors | 2.76 |
3.1.3 Volatility
| Company | Volatility |
| Ferrari | 0.20 |
| Subaru | 0.67 |
| Lincoln | 0.38 |
| Maruti Suzuki | 0.45 |
| Toyota Motors | 0.58 |
I. Ferrari
Volatility: 0.20
Interpretation: Ferrari has the least volatility amongst the unsustainable companies, indicating that it has very few fluctuations or no fluctuations in the short term. Before the announcement of their EVs, the stock prices were stable and have remained as such because of the image that Ferrari has cultivated of itself.
II. Subaru
Volatility: 0.67
Interpretation: Subaru has the highest volatility amongst the unsustainable car brands, indicating that the price of its stocks fluctuate rapidly in the short term, which can also be observed on the market cap graph between 2015-2024. One of the reasons for this is due to the lack of EVs and constant developments in other ways to become sustainable.
III. Lincoln
Volatility: 0.38
Interpretation: In comparison to the other unsustainable companies, Lincoln has one of the least volatilities, indicating less fluctuations in the short term. Its stability comes from the brand loyalty that people have towards a long standing, highly innovative company. Their preemption of an upcoming electric vehicle may have also contributed towards their low volatility.
IV. Maruti Suzuki
Volatility: 0.45
Interpretation: Maruti Suzuki can be said to have a moderate volatility, indicating that its stock prices fluctuate but not significantly in the short term. This is due to their rising popularity in India as one of the major producers of automobiles. However, the slow takeoff of electric vehicles might have contributed to its volatility as there are unpredictable market conditions.
V. Toyota Motors
Volatility: 0.58
Interpretation: Toyota Motors has the second highest volatility, indicating that it also has a high fluctuation in the price of its stocks in the short term. This can be linked towards Toyota’s stance on EVs and the prioritisation of other hybrid and hydrogen cars.
Chapter 4: Comparison
| Company (EV Successful) | Compound Annual Growth Rate (CAGR) (%) | Company (No EV) | Compound Annual Growth Rate (CAGR) (%) |
| BYD | 17.23 | Ferrari | 24.02 |
| Tesla | 36.19 | Subaru | -6.92 |
| Volkswagen | -7.20 | Lincoln | 11.41 |
| Geely | 11.88 | Maruti Suzuki | 8.09 |
| Mercedes-Benz | -4.36 | Toyota Motors | 2.76 |
| Mean CAGR | 10.35 | Mean CAGR | 7.07 |
| Variance | 332.31 | Variance | 156.87 |
| Standard Deviation | 18.22 | Standard Deviation | 12.52 |
Table 12. CAGR of EV and Non-EV Companies.
4.1 Mean CAGR
The mean CAGR for EV companies (10.35%) is higher than that for non-EV companies (7.07%). This suggests that, on average, companies focused on electric vehicles are experiencing stronger growth. This higher growth can be linked to the increasing societal shift towards sustainability, environmental concerns, and the growing adoption of EVs. Governments and consumers are pushing for greener technologies, and EV companies are benefitting from this trend.
On the other hand, non-EV companies have a lower mean CAGR, indicating more modest growth compared to their EV-focused counterparts. Many of these companies operate in established markets with less dramatic shifts. Their growth is often driven by brand loyalty, incremental innovations, and stable market demands.
4.2 Standard Deviation and Variance
EV companies exhibit higher variance (332.31) and standard deviation (18.22) compared to non-EV companies. This indicates that while EV companies have higher growth potential, they also experience significant fluctuations in their market cap growth. The higher volatility can be attributed to the rapid pace of innovation, evolving market dynamics, and regulatory changes in the EV sector. Investors’ expectations and market reactions to new technologies, product launches, and policy changes contribute to this variability.
Non-EV companies have lower variance (156.87) and standard deviation (12.52), indicating more stable and predictable growth patterns. The lower volatility reflects the steady performance of these companies, which benefit from well-established market positions and relatively conservative strategies compared to the dynamic and fast-evolving EV market.
4.3 T-Test Analysis: Comparison of CAGR Between EV and Non-EV Companies
To evaluate whether EV companies have experienced higher growth rates compared to traditional non-EV companies, we have conducted an independent sample t-test on the CAGR of five EV-focused companies and five non-EV companies. The data used for this analysis are presented in Table 12.
4.3.1 Hypotheses
- H0: µ CAGR of EV car brands = µ CAGR of non-EV car brands
- H1: µ CAGR of EV car brands > µ CAGR of non-EV car brands
- And ∝ = 0.05
The mean CAGR for EV companies was calculated to be 10.35%, with a standard deviation of 18.22%. For non-EV companies, the mean CAGR was 7.07%, with a standard deviation of 12.52%.
Using the t-test formula:
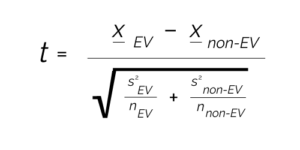
- Where x EV = 10.35
- x non-EV = 7.07
- s EV = 18.22
- s non-EV = 12.52
- n EV = n non-EV = 5
4.3.1 Results
T-value = 0.31
For a one-tailed test at the 0.05 significance level, the critical value of t is approximately 1.86. Since 0.31 is less than the critical t-value (1.86), we fail to reject the null hypothesis. Therefore, we do not have sufficient evidence to conclude that the mean CAGR of EV companies is significantly higher than that of non-EV companies.
Chapter 5: Conclusion
While the demand for electric vehicles (EVs) is indeed on the rise, as evidenced by the significant growth of companies like Tesla and BYD, there remains a considerable portion of the market that still prefers traditional gas-powered vehicles. This preference is highlighted by the decreasing market cap of traditional automakers such as Mercedes-Benz and Volkswagen, who have faced challenges in their transition to EVs. Despite the increasing sales of EVs, the overall demand has not met the high expectations set by industry executives and policymakers. According to PBS, the record sales of EVs in 2023 did not continue at the anticipated rate, leading major manufacturers like Mercedes-Benz and Volkswagen (despite having one of the leading EV cars) to slow down or delay their EV production plans due to concerns over market saturation and economic factors such as high vehicles prices and interest rates [Bennett].
The hypothesis test conducted further supports the observation that the growth rates of EV companies, while higher, are not significantly greater than those of traditional automakers when considering the broader market. The mean CAGR for EV companies was 10.35%, compared to 7.07% for non-EV companies. However, the t-test results, with a t-value of 0.31, indicate that this difference is not statistically significant, implying that the market is not yet fully integrated into EVs. The slow adoption of EVs, influenced by consumer concerns over charging infrastructure and practical aspects of EV ownership, suggests that it will take time for society to fully transition to electric vehicles [CNBC].
Bibliography
‘At the Racetrack.’ Shell Global, https://www.shell.com/what-we-do/technology-and-innovation/innovation-in-motorsport/decarbonising-motorsport/at-the-racetrack.html. Accessed 26 June 2024.
Bansal, Tima. ‘How Green Is Tesla, Really?’ Forbes, 13 May 2021, www.forbes.com/sites/timabansal/2021/05/13/how-green-is-tesla-really/.
‘Benefits of Electric Vehicles.’ e-AMRIT, https://e-amrit.niti.gov.in/benefits-of-electric-vehicles. Accessed 29 June 2024.
Bennett, G. ‘Why major car manufacturers are slowing production of electric vehicles.’ PBS, 30 January 2024, https://www.pbs.org/newshour/show/why-major-car-manufacturers-are-slowing-production-of-electric-vehicles. Accessed 28 June 2024.
Boles, E. ‘How unsustainable are Toyota cars? A life cycle analysis.’ Impactful Ninja, https://impactful.ninja/how-sustainable-are-toyota-cars/. Accessed 27 June 2024.
‘BYD e6 EV Sales Figures.’ Good Car Bad Car, https://www.goodcarbadcar.net/byd-e6-ev-sales-figures/. Accessed 29 June 2024.
Calma, J. ‘Elon Musk’s Sustainability Dreams for Tesla Need to Start in His Own Backyard.’ The Verge, 2 Mar. 2023, www.theverge.com/2023/3/2/23621205/elon-musk-tesla-masterplan-sustainable-energy.
Carlier, M. ‘Automotive industry worldwide – statistics & facts.’ Statista, 16 May 2024, https://www.statista.com/topics/1487/automotive-industry/#topicOverview. Accessed 22 June 2024.
Carlier, M. ‘Ford Motor Company – Statistics & Facts.’ Statista, 12 March 2024, https://www.statista.com/topics/1886/ford/#topicOverview. Accessed 29 June 2024.
‘Cars Impact On The Environment.’ The World Counts, https://www.theworldcounts.com/challenges/consumption/transport-and-tourism/cars-impact-on-the-environment. Accessed 29 June 2024.
‘Carter Subaru.’ Carter Subaru, 15 March 2024, https://www.cartersubaru.com/.
Duffy, C. ‘Ex-Employees Sue Elon Musk and SpaceX, Claiming Illegal Firings after They Called out Alleged Gender Bias and Harassment.’ CNN, 12 June 2024, edition.cnn.com/2024/06/12/tech/spacex-elon-musk-former-employees-lawsuit/index.html#:~:text=The%20lawsuit%2C%20brought%20by%20eight. Accessed 22 June 2024.
Eichler, R. ‘Compound Annual Growth Rate: What You Should Know.’ Investopedia, https://www.investopedia.com/investing/compound-annual-growth-rate-what-you-should-know/. Accessed 29 June 2024.
‘Electric vehicle life cycle analysis and raw material availability.’ DigitalOcean, https://te-cdn.ams3.cdn.digitaloceanspaces.com/files/2017_10_EV_LCA_briefing_final.pdf. Accessed 29 June 2024.
‘EV euphoria is dead. Automakers trumpet consumer choice in U.S.’ CNBC, 13 March 2024, https://www.cnbc.com/2024/03/13/ev-euphoria-is-dead-automakers-trumpet-consumer-choice-in-us.html. Accessed 28 June 2024.
‘Ferrari and shell extend Partnership till 2030.’ automobili Ferrari, February 19 2024.
‘Ferrari Green Initiatives.’ Scuderia Ferrari Club, https://sfcriga.com/ferrari-green-initiatives. Accessed 17 June 2024.
‘Ferrari opens new $214 million plant in Italy to speed up development of new car models.’ Tech Times, https://www.techtimes.com/articles/305942/20240621/ferrari-opens-new-214-million-plant-italy-speed-up-development.html. Accessed June 22 2024.
Ford, H, Gitlin, J. M. ‘Electric vehicle.’ Wikipedia, https://en.wikipedia.org/wiki/Electric_vehicle. Accessed 29 June 2024.
‘From SPACs to chips: Five ways 2021 may have forever changed the auto industry.’ CNBC, 31 December 2021, https://www.cnbc.com/2021/12/31/five-ways-2021-may-have-forever-changed-the-auto-industry.html . Accessed 29 June 2024.
‘Geely Auto Group Unveils its New Short Blade EV Battery Technology.’ Geely, https://global.geely.com/en/news/2024/geely-auto-unveils-new-short-blade-ev-battery-technology. Accessed 29 Jun 2024.
‘Geely launches short blade EV battery with high energy density, fast charging.’ ETN, https://etn.news/e-mobility-blogs/geely-short-blade-ev-battery-technology-details. Accessed 29 Jun 2024.
‘Global Electric Vehicle Market In 2024.’ Virta, https://www.virta.global/global-electric-vehicle-market. Accessed 28 June 2024.
Guide, S. ‘BYD Electric Vehicles: A Journey Through History and Models.’ Silverstone Leasing, https://www.silverstoneleasing.com/the-history-of-byd. Accessed 29 June 2024.
‘Has Lincoln Stepped Into the Electric Car Arena?’ Riser Lincoln, https://www.riserlincoln.com/lincoln-electric-car-arena.html.
Hawkings, T. R. Singh, B, Majeau-Bettez, G, Strømman, A. H. ‘Comparative Environmental Life Cycle Assessment of Conventional and Electric Vehicles.’ onlinelibrary.
‘Here’s Why Maruti Is Not Participating In The EV Race.’ NDTV Profit, https://www.ndtvprofit.com/business/heres-why-maruti-is-not-participating-in-the-ev-race-3553770. Accessed 29 June 2024.
‘Historical Business Performance‘. Subaru Corporation. https://www.subaru.co.jp/en/ir/finance/business-performance.html.
‘History of Subaru.. Grand Subaru. https://www.grandsubaru.com/the-history-of-subaru.html.
‘History of Subaru.’ Subaru Middle East. https://subaru-middleeast.com/history-of-subaru/#:~:text=Early%20Origins%3A,thus%20creating%20the%20Subaru%20brand.
‘India’s Maruti Suzuki looks beyond EVs for green growth.’ Nikkei Asia, 13 October 2023, https://asia.nikkei.com/Business/Business-Spotlight/India-s-Maruti-Suzuki-looks-beyond-EVs-for-green-growth. Accessed 29 June 2024.
‘Investor Relations.‘ Subaru Corporation, 27 June 2024, https://www.subaru.co.jp/en/ir/.
‘Learn About Impacts of Diesel Exhaust and the Diesel Emissions Reduction Act (DERA).’ Environmental Protection Agency, https://www.epa.gov/dera/learn-about-impacts-diesel-exhaust-and-diesel-emissions-reduction-act-dera. Accessed 29 June 2024.
Lesjak, Ž. ‘BYD Sales by Model and Country (2024 Statistics).’ Tridens Technology, https://tridenstechnology.com/byd-sales-statistics/. Accessed 29 June 2024.
‘Lincoln Electric – Higher Standards 2025 Strategy.’ Sustainability, https://sustainability.lincolnelectric.com/higher-standard-2025-strategy.html. Accessed 29 June 2024.
‘Lincoln Electric (LECO) – Market capitalization.’ Companies Market Cap, https://companiesmarketcap.com/lincoln-electric/marketcap/. Accessed 29 June 2024.
‘Lincoln roadmap to net zero carbon.’ Lincoln Climate Commission, https://www.lincolnclimate.org.uk/sites/default/files/Lincoln%20roadmap%20to%20net%20zero%20carbon.pdf. Accessed 22 June 2024.
‘Lithium Iron Phosphate (LiFePO4) Batteries.’ Eco Tree Lithium, https://ecotreelithium.co.uk/category/lithium-iron-lifepo4-batteries/. Accessed 29 June 2024.
Lyon, P. ‘Total EV adoption is not the way forward, says Toyota chairman.’ Forbes, March 3 2024, https://www.forbes.com/sites/peterlyon/2024/03/03/bucking-industry-trend-toyota-chairman-downplays-ev-growth-predictions/#. Accessed June 25 2024.
Mackintosh, P. ‘Lincoln Electric (LECO) Dips 21% in 3 Months: Will It Recover?’ Nasdaq, https://www.nasdaq.com/articles/lincoln-electric-leco-dips-21-in-3-months:-will-it-recover. Accessed 29 June 2024.
‘Maruti Suzuki 40 Years Celebration: A look at the company’s journey.’ mint, https://www.livemint.com/auto-news/maruti-suzuki-40-years-celebration-a-look-at-the-company-s-journey-11662880263595.html.
‘Maruti Suzuki India seeks correct accounting of greenhouse gas emission benefits of ethanol.’ The Economic Times, 12 December 2022, https://economictimes.indiatimes.com/industry/auto/auto-news/maruti-suzuki-india-seeks-correct-accounting-of-greenhouse-gas-emission-benefits-of-ethanol/articleshow/96178835.cms?from=mdr. Accessed 22 June 2024.
‘Maruti Suzuki Sustainability at Core – MSengage.’ Maruti Suzuki, https://www.marutisuzuki.com/engage/technology/sustainability.html. Accessed 29 June 2024.
Mukhergee, S. ‘Suzuki predicts India market to expand 2% in FY25, Maruti to outpace industry growth.’ The Economic Times, 13 May 2024, https://economictimes.indiatimes.com/industry/auto/auto-news/suzuki-predicts-india-market-to-expand-2-in-fy25-maruti-to-outpace-industry-growth/articleshow/110092328.cms?from=mdr. Accessed 29 June 2024.
O’Neil, J. ‘Why Lincoln’s Days Are Numbered – Electric Cars.’ Top Speed, 11 May 2023, https://www.topspeed.com/why-lincolns-days-are-numbered/. Accessed 29 June 2024.
‘Reduce Climate Change.’ Fuel Economy, https://www.fueleconomy.gov/feg/climate.shtml. Accessed 22 June 2024.
Reuters, D. ‘Toyota Settles US Probe into Delayed Emissions Defect Reports for $180 million.’ January 14 2021, https://www.reuters.com/article/idUSKBN29J284/. Accessed June 20 2024.
‘Senior Maruti Suzuki executive on why hybrids are gaining traction and not EVs.’ The Economic Times, 7 February 2024, https://economictimes.indiatimes.com/industry/renewables/senior-maruti-suzuki-executive-on-why-hybrids-are-gaining-traction-and-not-evs/articleshow/107481038.cms?from=mdr. Accessed 29 June 2024.
Sharma, M. ‘May 2024: Top Selling Maruti Cars.’ Spinny, 13 June 2024, https://www.spinny.com/blog/index.php/best-selling-maruti-cars/. Accessed 29 June 2024.
Simms, D. ‘How Sustainable Is Tesla?’ LeafScore, 7 Mar. 2023, www.leafscore.com/tesla/just-how-sustainable-is-tesla/.
‘Subaru loves the earth.‘ Subaru of America, 20 March 2024, https://www.subaru.com/our-commitment/love-promise/subaru-loves-the-earth.html.
‘Sustainability.’ Maruti Suzuki, https://www.marutisuzuki.com/corporate/about-us/sustainability. Accessed 29 June 2024.
‘Sustainability.’ Toyota Motor Corporation, https://global.toyota/en/sustainability/#:~:text=We%20continue%20to%20promote%20various,the%20material%20level%2C%20as%20well! Accessed 28 June 2024.
Swallow, T. ‘Top 10: Electric Vehicle Companies.’ Energy Digital Magazine, 27 September 2023, https://energydigital.com/top10/top-10-electric-vehicle-companies. Accessed 22 June 2024.
‘Tesla (TSLA) – Market Capitalization.’ Companiesmarketcap.com, companiesmarketcap.com/tesla/marketcap/#google_vignette.
‘Trends in electric cars – Global EV Outlook 2024.’ International Energy Agency, https://www.iea.org/reports/global-ev-outlook-2024/trends-in-electric-cars. Accessed 22 June 2024.
‘Trends in electric light-duty vehicles – Global EV Outlook 2023.’ International Energy Agency, https://www.iea.org/reports/global-ev-outlook-2023/trends-in-electric-light-duty-vehicles. Accessed 29 June 2024.
Ugorji, E. ’10 Automakers That Still Don’t Have An EV On Sale.’ Top Speed, 29 December 2023, https://www.topspeed.com/automakers-that-still-dont-have-an-ev/. Accessed 29 June 2024.
‘U.S. Markets Declined Thursday; Lincoln Electric Took Biggest Hit.’ Barron’s Automation, https://www.barrons.com/articles/u-s-markets-declined-thursday-lincoln-electric-took-biggest-hit-b0cef8a0.
Velasquez, V. ‘Volatility: Meaning in Finance and How It Works With Stocks.’ Investopedia, https://www.investopedia.com/terms/v/volatility.asp. Accessed 29 June 2024.
‘Will the Ferrari brand appear when it’s all electric.’ Sherwood, https://sherwood.news/business/ferrari-high-profit-margin-new-ev-supercar-impact/.
Wise, M. ‘Which car brands emits the most carbon dioxide.’ Earth 911, 22 June 2021, https://earth911.com/business-policy/which-car-brands-emit-the-most-carbon-dioxide/. Accessed 17 June 2024.
‘Why Warren Buffett’s Berkshire Sold Down Stake in Chinese EV Maker BYD.’ Markets Insider, 14 November 2023, https://markets.businessinsider.com/news/stocks/byd-stock-sales-warren-buffett-berkshire-hathaway-china-ev-munger-2023-11. Accessed 29 June 2024.
‘2024 Toyota bZ4X.’ Edmunds, https://www.edmunds.com/toyota/bz4x/#:~:text=The%202024%20Toyota%20bZ4X%20is,trim%20levels%3A%20XLE%20and%20Limited. Accessed 28 June 2024.


